
Reporting is here
The SSP UI is changing the main dashboard into 4 tabs under the new Insights section.
When you log in to the programmatic platform, you will now land on our improved Insights section, and by default the Deal Dashboard will be your new dashboard.
The Deal Dashboard will offer you an overview of your traded deals and by using the filters at the top of the page you will be able to drill down into the details by Deal ID, DSP, Deal type and Timeframe (to and from), and Trading model.
Any filters applied on one of the tabs will persist as you navigate across the insights dashboards, this saves you time having to re-enter your filters as you track the performance of your deals.

Know your Insights
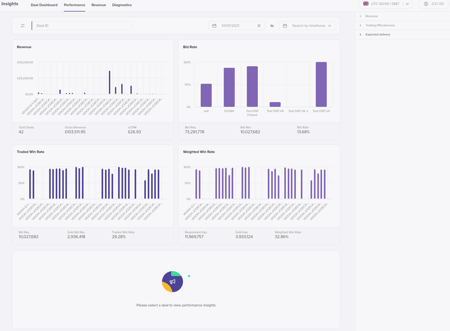
Below the filter panel, you’ll see the four 'hero' charts which are present on all four of the new sub-navigation pages.
These display Revenue, Bid Rate, Traded Win Rate, and Weighted Win Rate, and give you a quick glimpse into the overall health of your deals.
ℹ️ If you have applied filters, you’ll see these charts update to show the revised data.

Compare Deals
Revenue 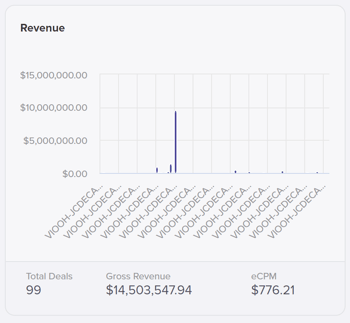
Provides you with a quick view of revenue broken out per deal ID.
Below the chart you’ll see the key insights: the total number of deals, gross revenue, and average CPM.
Bid Rate 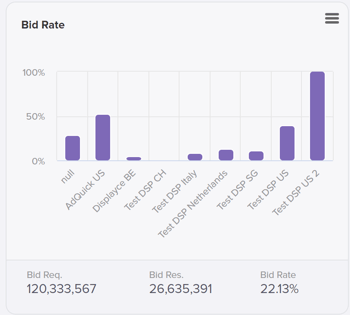
A key metric in tracking the buying commitment from your DSP. This metric is measured by calculating the sum (bid responses / bid requests)
Below the chart you can see the metrics of how this calculation is made up, showing the sum of all bid requests, bid responses and overall bid rate %.
Traded Win Rate 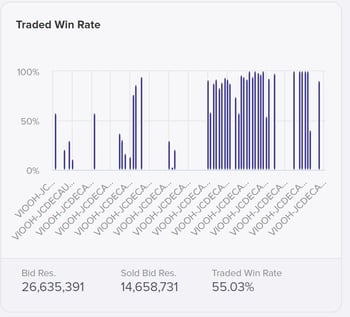
When trading we calculate the % rate based on the sum (Bid responses Won / Bid Responses).
Again these metrics can be seen below the chart with the overall average Traded Win Rate displayed.
Weighted Win Rate
Since we trade impressions it is critical that we report performance in the same way.
As we transition each of our DSPs to play based auctions we must ensure that we also convert these plays to the volume of impressions sold at a given hour.
We have introduced 2 new metrics to support this - offered impressions and responded impressions:
- Offered impressions - the number of impressions offered with any play during any trading opportunity.
- Responded Impressions - the number of impressions the DSP has asked to purchase with every auction response.
sum (sold impressions / Responded Impressions)
Below the hero charts, you’ll find an expansive table that displays key data metrics per deal.

Here, you will be able to quickly glance at this information to compare the performance between different deals or get a quick idea of how the different metrics weigh up against each other.
On the data table, you’re able to sort the data into ascending or descending order by clicking the title of the column.
You can either view the data in the platform or download the data to XLS.
Focus your insights on a single deal 🔍
Performance
When analysing your deal, you can now see performance based on the traded hours to identify key trends during the trading day.
To utilise the full functionality of the Performance page, you should be filtering by a deal ID - but if not, by default you’ll see the same four hero charts, with the status set to Live, and timeframe set to the Active month.

Revenue, Bid Rate

Traded Win Rate, Weighted Win Rate

Once a deal ID filter has been entered in the search bar, you’ll see 3 charts appear:
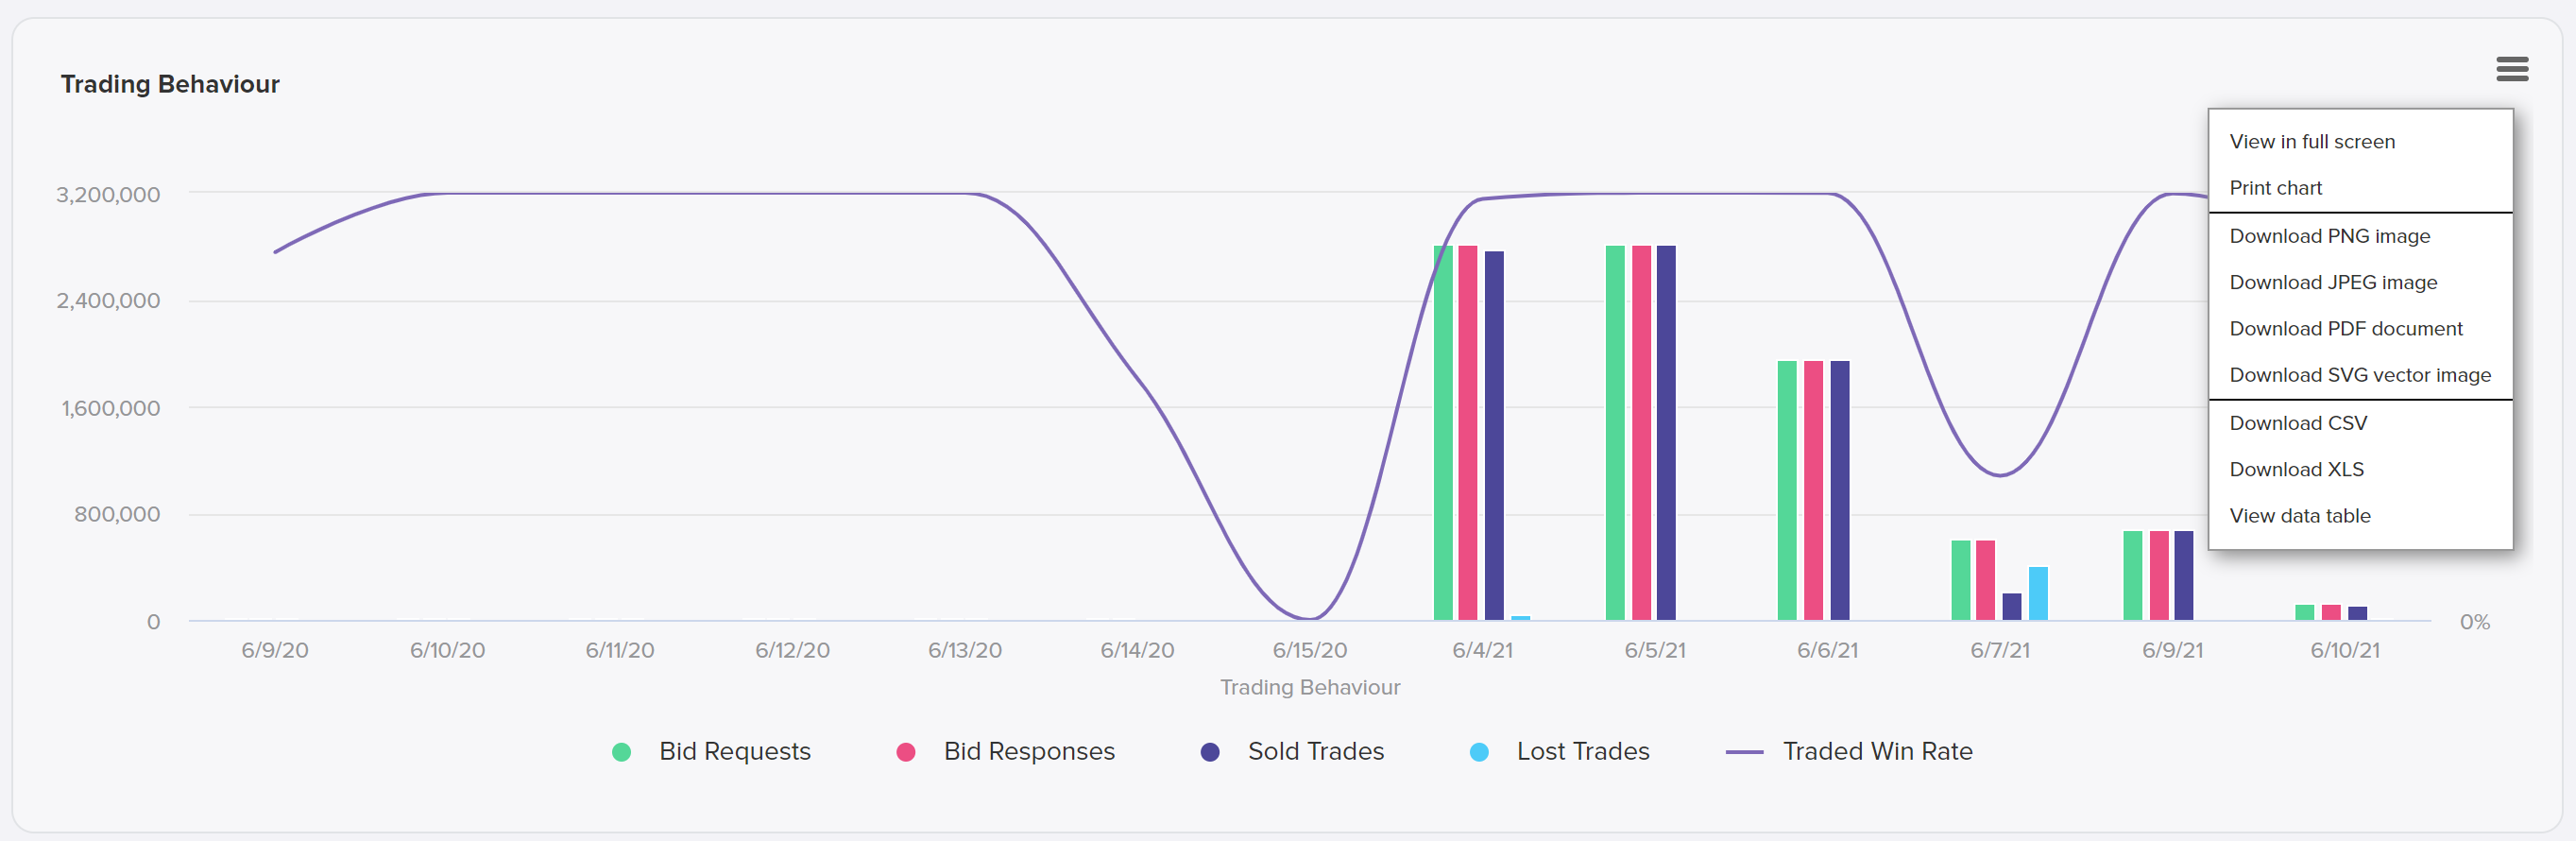
Trading behaviour where you’ll be able to see bid requests, responses, sold trades, lost trades and traded win rate against the date on the x-axis.
The date should follow the format for the market you’re in, so in the UK this should be set as dd/mm, whereas the US will see this as mm/dd.
Impressions traded, where you can see offered impressions, responded impressions, sold impressions, lost impressions and weighted win rate, against the date on the x-axis.

The Revenue chart shows the gross revenue and eCPM against the date on the x-axis.

On the right-hand panel; you’ll see all the data about the deal, grouped into 4 buckets;

- Deal overview.
- Revenue
- Trading Effectiveness.
- Expected delivery.
You can open and close the panels using the expanders on the menu.
Similar to before, you’ll still be able to access the Performance page by clicking on the pie chart in the Deal Management page, which will take you straight to the Performance page with the deal filter already applied.
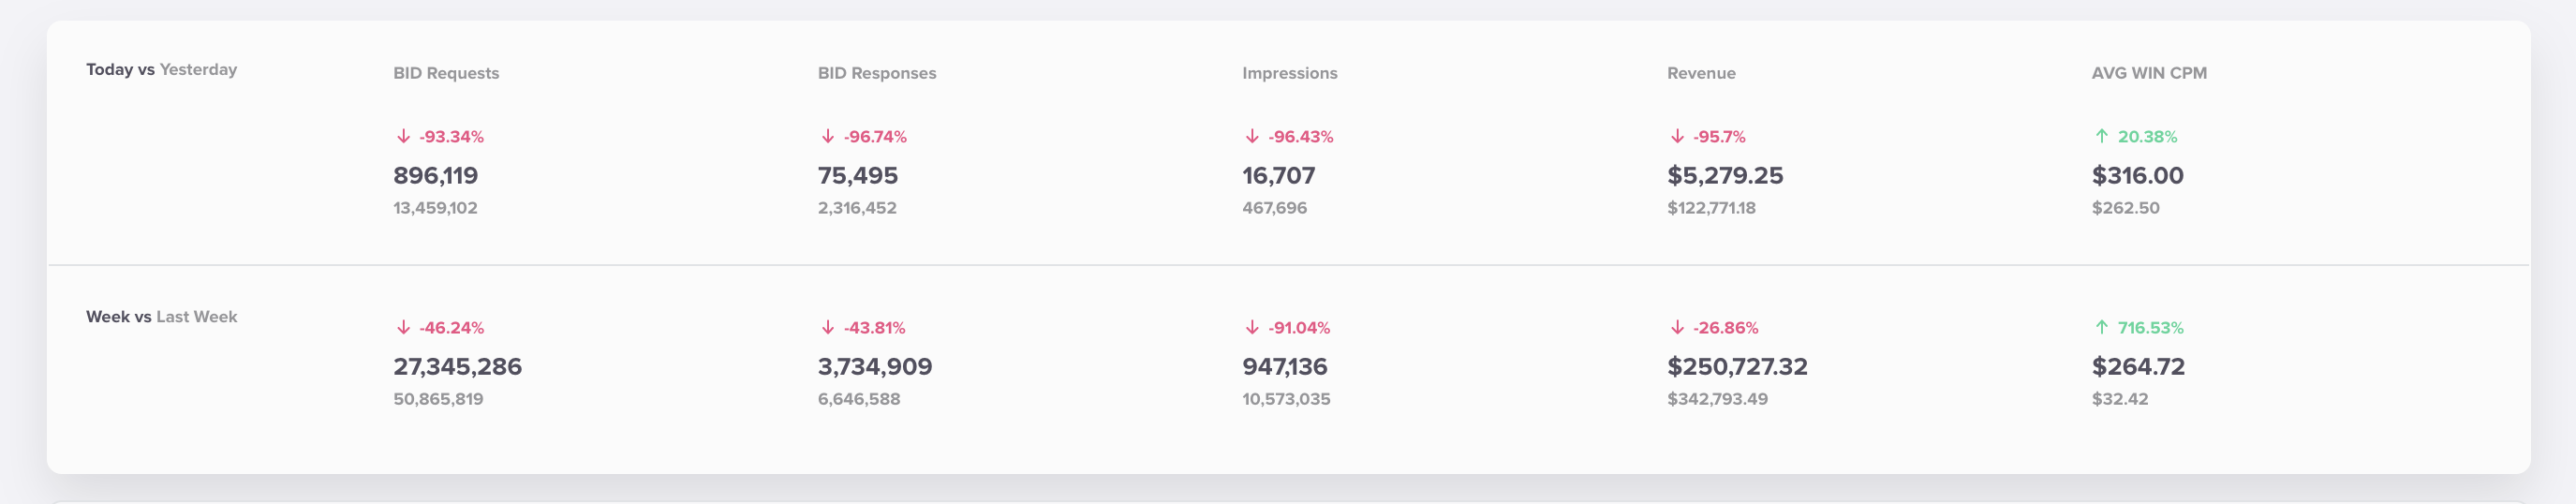
Revenue
On the Revenue page, you’ll see the stats that you were used to see on the main dashboard, showing all the same information, focused on today vs yesterday, and this week vs last week.
Revenue Snapshot
Beneath the stats, you’ll see the filter panel and four charts - which should all update once any filters are applied
Month on Month day comparison which displays this month and last months revenue and impressions - broken out by day of the month.
Month on Month Day Comparison
CPM which shows the buying and selling CPM of this month vs last month also broken out by day of the active month.
CPM
DSP Revenue by Month - Last 12 months which breaks down the revenue by each active DSP over the last year.
DSP Revenue by Month
DSP Revenue by day which allows you to see overall revenue by day for the active month, broken out by DSP.
DSP Revenue by Day
Diagnostics

On the revised diagnostics page, you’ll see more filter options at the top; where you can filter by
- Loss type, whether that be bids or creative losses. When a loss type is applied the loss codes will also be conditionally filtered.
- Loss codes.
- Creative ID, to see impacts by creative and data for deals linked to the creative.
- Deal ID
- DSP
- Timeframe (to and from)
- Trading model.
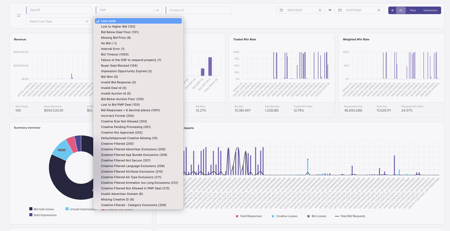
You can further filter down by loss code if you wish.
Here you’ll see a dropdown of all the loss codes and reasons.
Below the hero charts, you’ll find have two pie charts and two graphs.
The Summary Overview
Displays Bid total losses, Unsold impressions, Creative total losses and Sold impressions as a percentage value totalling 100%
To the right, you’ll see All Deal Trading Impacts.

Impacts will show you Sold Responses, Creative Losses, Bid Losses and Total Bid Requests per deal.
Below this, Total impacts by loss category breaks out losses by bids and creative which you can see as an impression value and percentage figure.

And lastly, Total lost impressions which displays the impressions lost per bid loss reason.
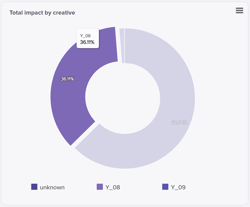
When the deal ID filter is set a new chart will be presented showing deal impacts by creative.
Total Impact by creatives is complemented by the All Deal Trading Impacts insight chart.
Key features 🔑
Interactive charts
On all the charts, you can hover over the chart data to see the values in more detail.


Below the charts, there’s also the Data table with the raw data available to view. By default, the table is sorted in date order, with the latest data displayed at the top.
The table has pagination implemented to be able to see all the data clearly.
Here, you will be able to quickly glance at this information to compare the performance between different deals or get a quick idea of how the different metrics weigh up against each other. On the data table, you’re able to sort the data into ascending or descending order by clicking the title of the column.

ℹ️ You can either view the data in the platform or download the data to XLS
To view the charts in more detail, you can click expand at the top of each chart to see the data in full screen or to download or print the chart data. 
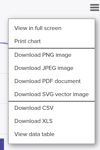
Hover over your chart to show your sub menu and the options to review and share your deals performance insights.
 Clicking to view data table will show you the data behind the chart below.
That's all for now folks! We hope you enjoy the new features and don't forget to let us know what you think. Send an email with your feedback direct to our product team via ProductBoard.
- For a video tutorial (coming soon!) on using the new reporting features, please visit the Learning Zone.
- An overview of reporting pages can be found in the Materials Library