
Improvements
Our focus for this update targets data continuity and improved trading metrics.
-
We have improved the continuity and calculation of the Win rate and Fill Rate metrics.
-
Play based trading data is now offered across all deal level reporting, this works in sync with Impression trading.
-
We have also fixed some bugs to ensure that your data remains in sync, ensuring our programmatic reporting meets your expectations.
Please reach out to your account team if you have any questions on these topics.
Play data
Now available on the Programmatic Platform, whether a DSP is transacting by Impressions or Plays, we are now able to present all the trading types on the UI.
-
When your DSP partners are exclusively trading based on Plays then your trading data will always be shown based in plays
-
When your partner DSPs are configured to trade by either impressions or Plays, which means there is a combination of trading types, then our Dashboard will will convert the metrics to impressions.
Dashboard: Play data
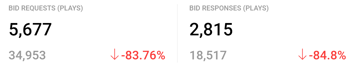
Play based Label Updates
 When trading in
Plays
you will now see the
play label
in brackets next to the metric header.
When trading in
Plays
you will now see the
play label
in brackets next to the metric header.
-
Bid Requests (Plays) -
Bid Responses (Plays)
Deal management: Play data
Bid charts
Have been revised to show you the trading metric of your deal.
When your DSP is configured to trade by Plays or have been configured to use the impression multiplier the data will always be shown based on plays
Some DSPs may still be trading based on Impressions, when this is case you will see these figures based on Impression volumes.
ℹ️To improve clarity in the deal management page we will be looking to introduce a new column which will show you the trading model unitType: "PLAY" for the deal, Impressions or Plays
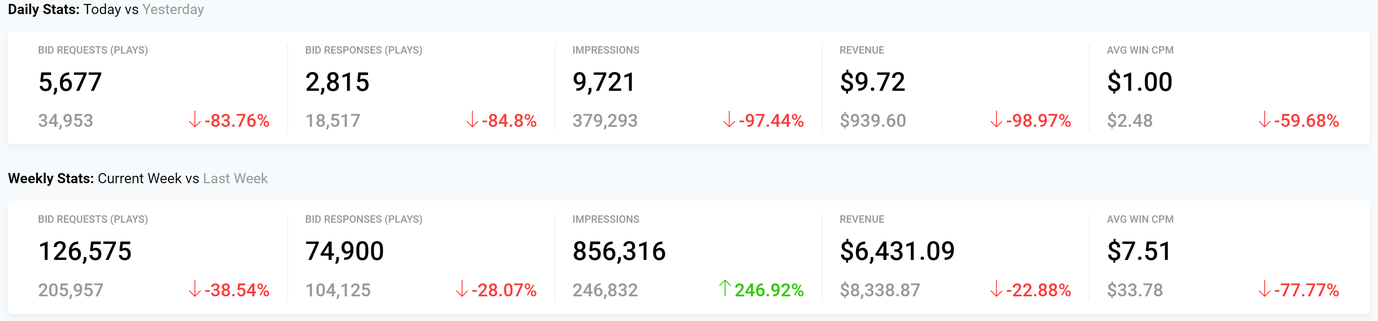
Deal Performance: Play data
Play based Label updates
When trading in Plays you will see the play label in brackets next to the metric header.
-
Bid Requests (Plays)

-
Bid Responses (Plays)
-
Sold Plays
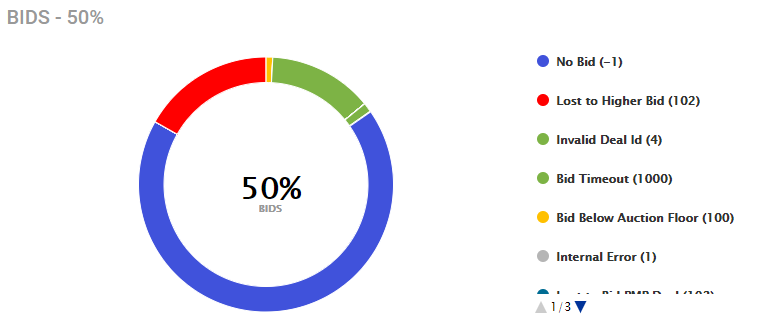
Diagnostics: Play data
Label updates
- Impressions Won is now labelled as Win rate
- Loss column under the chart will be rebelled as Lost Impressions
- DSP name will be visible.

- New loss data will be introduced offering you more insights on your trading.
New Loss Reasons

We have implemented the following list of loss reasons to diagnostics, use the arrow scroll options below each chart legend to view them on the UI. Reasons include covering Creatives and Bid data.
| Creative trading data (LOSS CODE) |
Bid data (LOSS CODE) |
|---|---|
|
|
Please note ⚠️We are not able to support Lost Play data in the Bid charts, we will be working on this update through to the new year. See future updates for more information.
Win rate calculation updates
To improve the continuity of the win rate metric we are capturing in the programmatic platform we have made the following revision.
The updated calculation will allow you to focus on the net success of any DSP trading across your deals.
1
Sold / Responses
Deal management page (Net)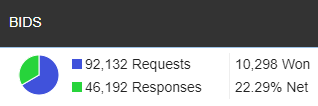
Deal Performance (Win rate)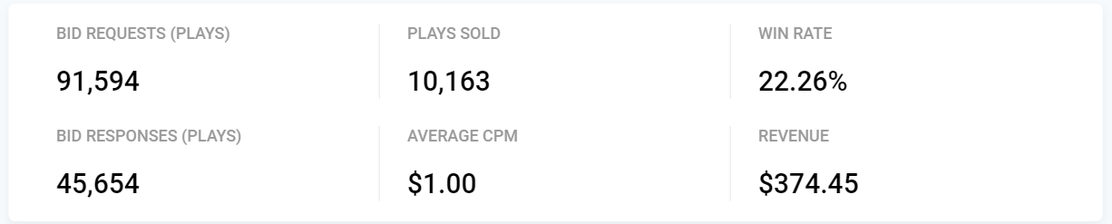
Deal Diagnostics (Win rate)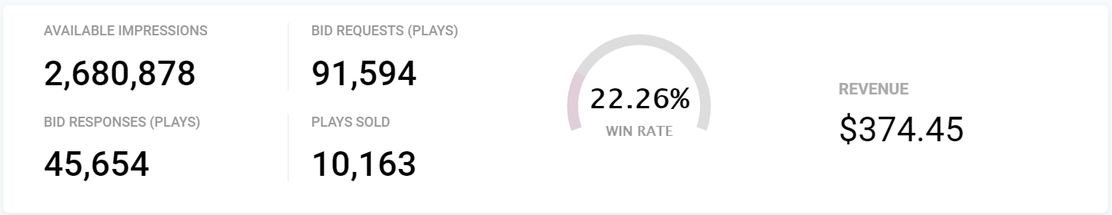
Fill rate calculation updates (impressions based)
New calculation
By capturing this metric we can measure what has been sold based on the available offering across your frames.
1
Sold / Available
ℹ️ The revised fill rate calculation is based on the Sold/Available trade data. In this release the calculation will be based exclusively on Impressions trading. Please follow future releases for Play based fill rates.
Bug fixes 👾🔨
Reporting discrepancies
Bid response fix
Solves a discrepancy between Deal Performance Bid Request value and the volume shown on the Diagnostics versus the Deal management bid charts.
Deal solution
Fixes an issue which presented the available impressions and CPM metrics as “0” values.
Revenue bug resolved
Solves an issue which presented conflicting revenue values in the UI cause by a rounding problem.
Average win CPM issue solved
Solves an issue which presented the Avg. Win CPM value which calculated decimals instead of whole numbers.
1 Avg Win CPM = totalcleraing cpm / sold impression
For example a test for deal, VIOOH-MEDIAOWNERNAME_AU-0000004924 presented a demand CPM as 1 and an Avg Win CPM 0.96 instead of 1.
Missing data in the Lost impression metrics, bug fixed
Issue have been resolved with the introduction of all available loss reasons to verify all “lost impression” data.
Revenue data
Implemented an revised calculation to capture revenue and sold impression based on the booked spans.
Note: As we don't have any date filter on PPUI listing, to compare with Redash we need to remove all filters from Redash and then compare.
Time zone data validation
The expected behavior should show data in the UI based on the the TZ drop down available on the SSP UI.
The option at the top of the UI page should always show the data in the platform based on the set TZ.
This discrepancy is solved when testing non-local market data by setting your machine TZ to that of the deal location.
E.g. setting your laptop to AUZ Sydney time and then refresh the page to see the data values match across the Platform.
⚠️This is not a blocker because we can assume that the client using the application will not be affected, this because they will already be viewing the deal in local time.
Request timeout
To resolve an issue between the programmatic data service we have extended a timeout policy.
Phew, that's all folks! That was a long one...well done if you made it down to here! 👋